Community as a Concept
CAC to lower your CAC

I had to put together some analysis on the data pipeline industry recently, and thought I should share it out. We’ll go through:
The data pipeline industry has a TAM of >$100bn, with some companies alone valued close to that 1. Since data pipelines are a broad area, I’ll restrict discussion to sectors more relevant to data analysis. A mix of public and private companies compete to fit within the technology stack of organisations using data, which is essentially every sizable firm today 2.
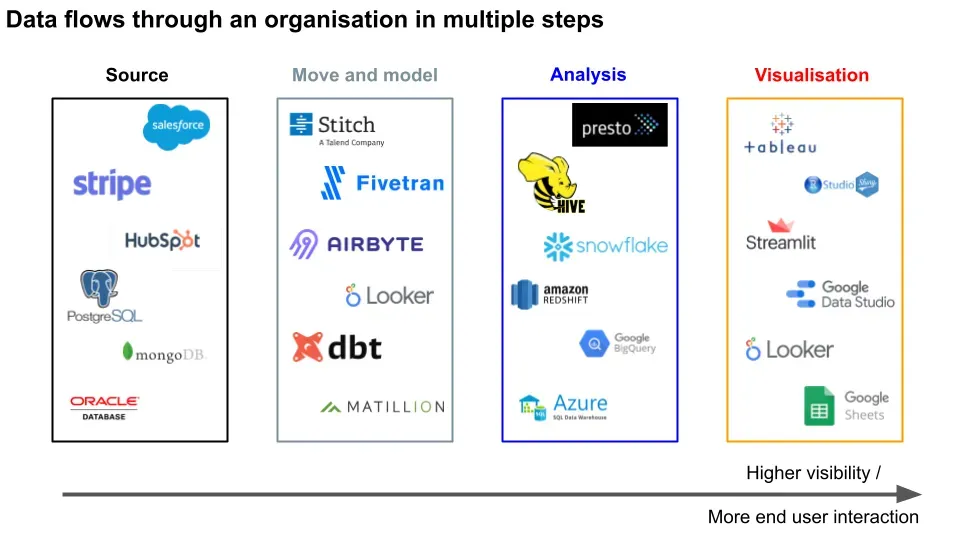
Data flows from customer or supplier generated interactions, into raw transactional databases. The data is then **moved **and transformed to the appropriate model for analytical data warehouses. From there, analysts can query for the data they’re interested in analysing. They use the results for end user data visualisation of business metrics.
All of these processes in bold have companies specialised in either developing software or consulting on implementation. Most newer companies are cloud based (with some on-premise), sit on top of service providers such as Amazon Web Services (AWS) 3, and take advantage of the scalability, flexibility, and frugality to build high margin enterprises.
Given the growth rate of data generation and the revenue associated (>20% yoy), most startups within this space are exciting opportunities for investment, representing asymmetric risk/return ratios and proven high exit multiples. If you believe in the startup industry growing, you have to believe in the data pipeline industry supporting it.
We’ll start with what the user can see, on the visualisation end. When an analyst already has cleaned data formatted in the structure they want, they need to organise that information. This usually takes the form of a dashboard with graphs and tables. Some tools in this space include Tableau, Looker, Google Data Studio, R Shiny (browser based, user friendly dashboards), Streamlit (interactive data apps), or even Google Sheets.
The tradeoffs in choosing a tool here are the technical ability of the users vs the complexity of the data. If an organisation has many users that want to collaborate on the same project, a simple tool like Sheets works. If there are fewer users and feature requests, building something that can deal with larger loads in a dashboarding software could make sense.
Before visualisation, the analyst needs to…analyse the data. They do so by querying the data from a structured database with a query language. This could be something like Presto (low latency, low throughput) or Hive (high latency, high throughput).
These computations are done on a data warehouse layer, which can be something like Snowflake, Redshift, BigQuery, Azure. The ones gaining in popularity are cloud based, and some also allow for separate scaling and billing of compute vs storage usage. Data warehouses can be better for doing analysis than databases, which can be better for storing data.
The tradeoffs here include price, scaling, and support. For example, you might start out with open-source Postgres, but then eventually switch over to Snowflake when your company has scaled beyond the size Postgres is suited for and is encountering more technical bugs.
To get that data to the warehouses, there can be data moving and **data modelling **layers. Companies such as Stitch, Fivetran, Segment, Airbyte help you pull your data from raw sources (we’ll get to this shortly) and put it into your database so you can query it. Data movers are commonly known as some combination of Extract, Load, Transform (ELT), Extract, Transform, Load (ETL), or some subset of those combinations.
Data modellers such as dbt, Matillion, and Looker let you map that raw data into the structure that your warehouse requires. For example, dbt lets you transform your data in an integrated development environment (IDE), schedule transformation jobs, and create documentation of what the data is like.
The tradeoffs here are the usual price, complexity, and other technical features. For example, I believe Fivetran has more integrations whereas Stitch has fewer. The choice of a data moving tool can also affect the data modelling tool used - you can think of this as not needing to transform data twice.
All of that data comes from customer and supplier interactions as raw source data. This includes software tools like Salesforce, Zendesk, Hubspot (CRM). Since these are all different companies, their data formats are different - think of it as different currencies for different countries. Hence the need for the data movement and data modelling layers mentioned earlier.
The source data is likely stored in some database such as Postgres, MongoDB 6, or even Oracle if you’re a sucker for pain. Unlike the data warehouses, these databases are better at storing the interaction data as it gets generated in real time; they’re faster at writing, slower at being read.
Putting it all together:
Thanks to Paul Tune, Recurse Center participants Shae Matijs Erisson, Ori Dean Bernstein, Mikkel Paulson, Steven Li, Ryan Prior, Luke Barone-Adesi, Chirag Davé, Nathan Goldbaum, and Locally Optimistic members Jacob Matson, Arpit Choudhury, Gordon Wong, Kevin Hu, Itto Kornecki for taking a look at this.
I was required to provide TAM for my analyses, which imo are usually made up numbers. Anyway, here are mine: Snowflake (SNOW) alone trades at $70bn mkt cap on $200mm rev. Data visualisation is $10bn rev, data analysis $40bn, data warehousing $20bn, ELT/ETL $10bn, and database $50bn per industry press releases ↩
Past a certain scale it’s no longer feasible to store data in free personal plan spreadsheet software ↩
AWS is likely worth hundreds of billions on $10bn rev; I’ve excluded it and the other main providers from the analysis for simplicity ↩
The data can then be sold online, used for fraud, or held for ransom. For most companies it’s a matter of when they’re hacked, not if. ↩
Given the competition at most layers, there has usually been cost deflation on the whole, rather than inflation ↩
As Paul Tune points out, you can have both relational (Postgres, MySQL) and non-relational databases, like MongoDB and DynamoDB (an AWS product). The unstructured nature of the latter creates challenges for businesses trying to perform analysis. ↩
Get my next essays in your inbox:

CAC to lower your CAC

Plaid abstracts away the boring financial plumbing, enabling others to innovate faster.

What to write and how to promote
Comments